ATAC-seq Tutorial
Generating two basic sequence-specific ATAC-Seq plots: composite and heatmap
Goal: This tutorial provides a guide to generating 2 basic plots (Composite plot and Heatmap) using the ScriptManager platform and data generated by the Stanford Encode Project.
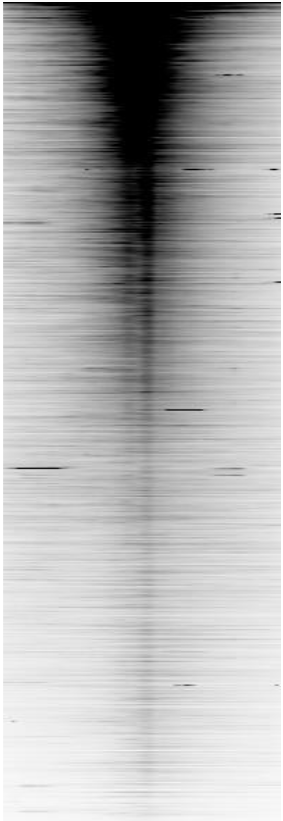

Download ScriptManager (v0.14):
The current version of ScriptManager is available for download here. Make sure you have Java installed.
The file ScriptManager-v0.14.jar should be placed someplace locally accessible. For example on Mac OS on the Desktop (Permissions will need to be accepted) or someplace in your home directory (Macintosh_HD:Users/userID/ScriptManager)
Download Data
You need one set of genomic coordinate regions to investigate (BED) and one file of sequencing data alignments (BAM) to complete this exercise. Read more about the BED/BAM file formats here.
BED File
This is the set of transcription start site (TSS) annotations for the GRCh38 genome build that has been subsampled down to 2000 sites for quick tutorial purposes. A more formal analysis may use a more complete set of annotations (many more sites).
Download sample BED fileIf your BED file downloads with a .txt extension, make sure to change the filename to a .bed extension. For this tutorial, the BED file is named UCSC_GRCh38_knownGene_GENCODEV3_TSS_2000bp_SUBSAMPLE-2000-Sites.bed.
BAM File
This is the set of read alignments from the ENCODE Project (ENCFF128WZG.bam).
The BAM file is ~6.5GB large so make sure you have enough space on your machine before downloading.
Generate the Plots
1. Open ScriptManager
- MacOS
- Linux
- Windows
Depending on your system permissions, you may need to be an administrator to open this for the first time. On Mac systems, this can be done by right-clicking the file and selecting ‘Open’ at the top.
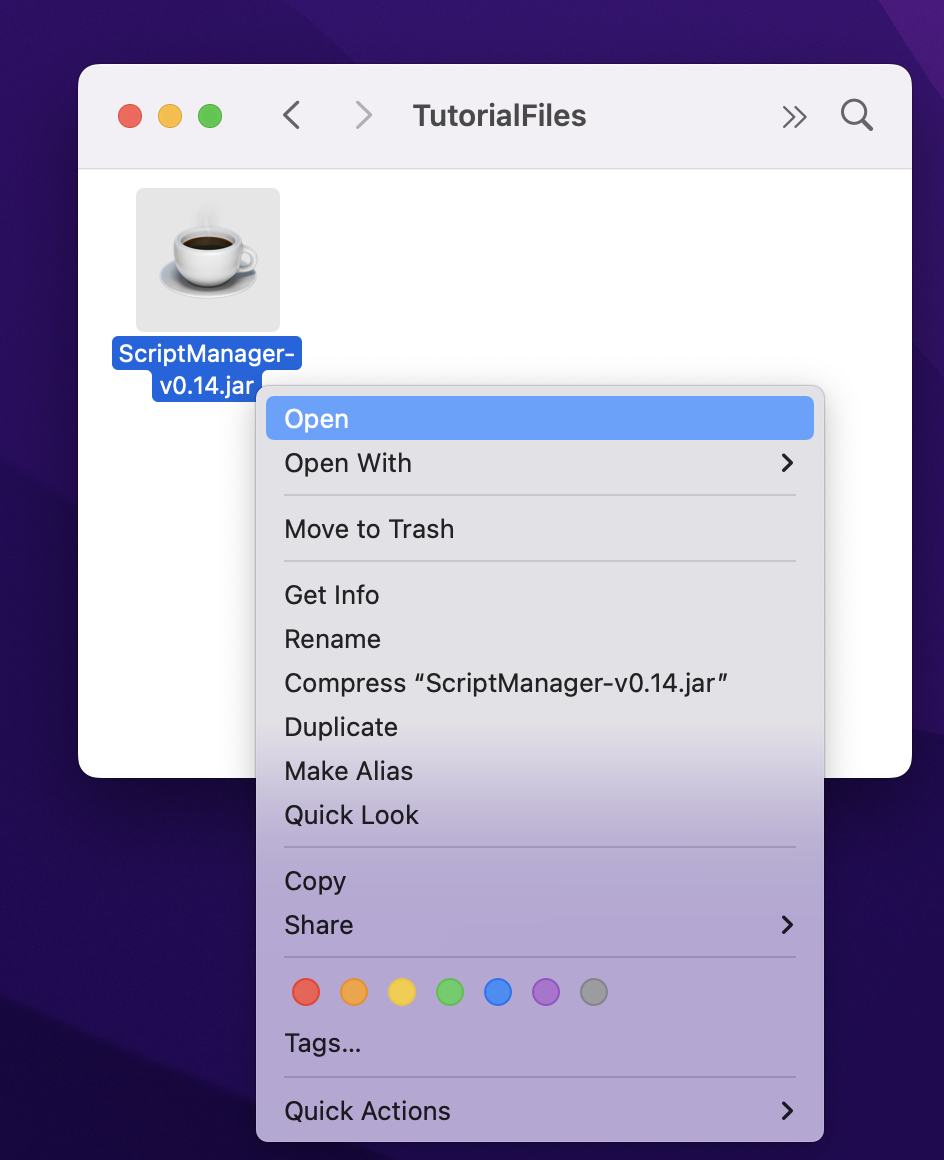
Some MacOS systems may not properly open the JAR by simply double-clicking on the JAR file so you may need to open your Terminal window and execute it from the command line by executing the jar file without any arguments or flags:
java -jar /path/to/ScriptManager.jar
If you're not sure how to type the path to ScriptManager, you can type java -jar (end with space) and then drag ScriptManager from Finder into your Terminal window and then press enter.
Double-click or right-click the ScriptManager JAR file to start the program.

Double-click or right-click the ScriptManager JAR file to start the program.

Once you see the main tool selection window, you're off to the races!
2. Generate BAI index file
A BAI index file is required for each BAM file of interest (i.e., the tag occupancy data you want to plot). This file allows for rapid access of the sorted and aligned sequence reads (BAM file).
SAM/BAM standard is to keep BAI file in same directory as BAM file with the ScriptManager-generated filename.
ENCFF534DCE.bam
ENCFF534DCE.bam.bai  # Need to generate this file to proceed.
2.1. Navigate to BAM Manipulation ➡️ BAM-BAI Indexer

2.2. Generate BAI index files for each BAM file of interest by loading your BAM file and clicking "Index." (228,000,000 tags processed)

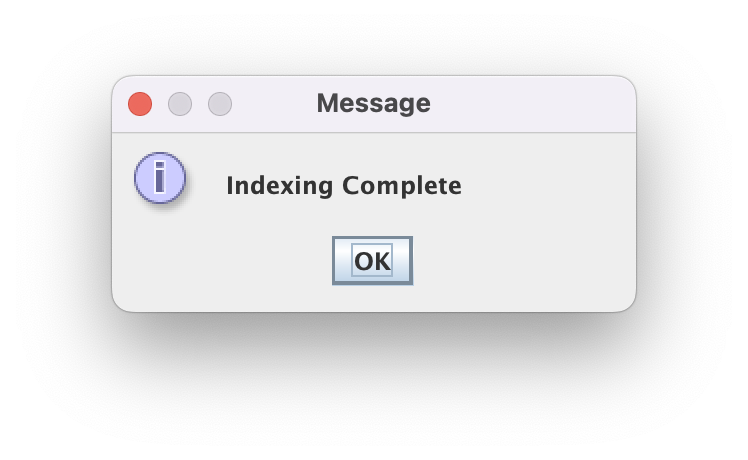
The speed of this step scales with the size of the BAM file. Generally this step 30 sec for a 100 MB BAM file but may take 1-2 min for a multi-GB BAM file.
3. BAM File Statistics
The BAM File Statistics is a Quality Control feature that includes alignment statistics that can be used to check what the data looks like. Paired-end Statistics is a common quality control step used in many ATAC-seq analyses.
3.1. Navigate to BAM Statistics ➡️ Paired-End Statistics
-dae4bd6e3bee1e1120f78b910c608921.png)
3.2. Select Output Statistics
-076eca6cdb7600135fe9db789588cbd5.png)

4. Resize the GRCh38 BED file
The BED file is the set of reference coordinates that your heatmap and composite plots will be aligned to, but you’ll need to specify how far upstream and downstream you want your data to be plotted; i.e., “Size of Expansion (bp). If you bed file is defined by more than a 1 bp interval AND you want to add to limits of that interval, then select “Add to Border”).
4.1. Navigate to Coordinate File Manipulation ➡️ Expand BED File

4.2. For this tutorial, use the 5000bp expansion and select "Expand from Center".
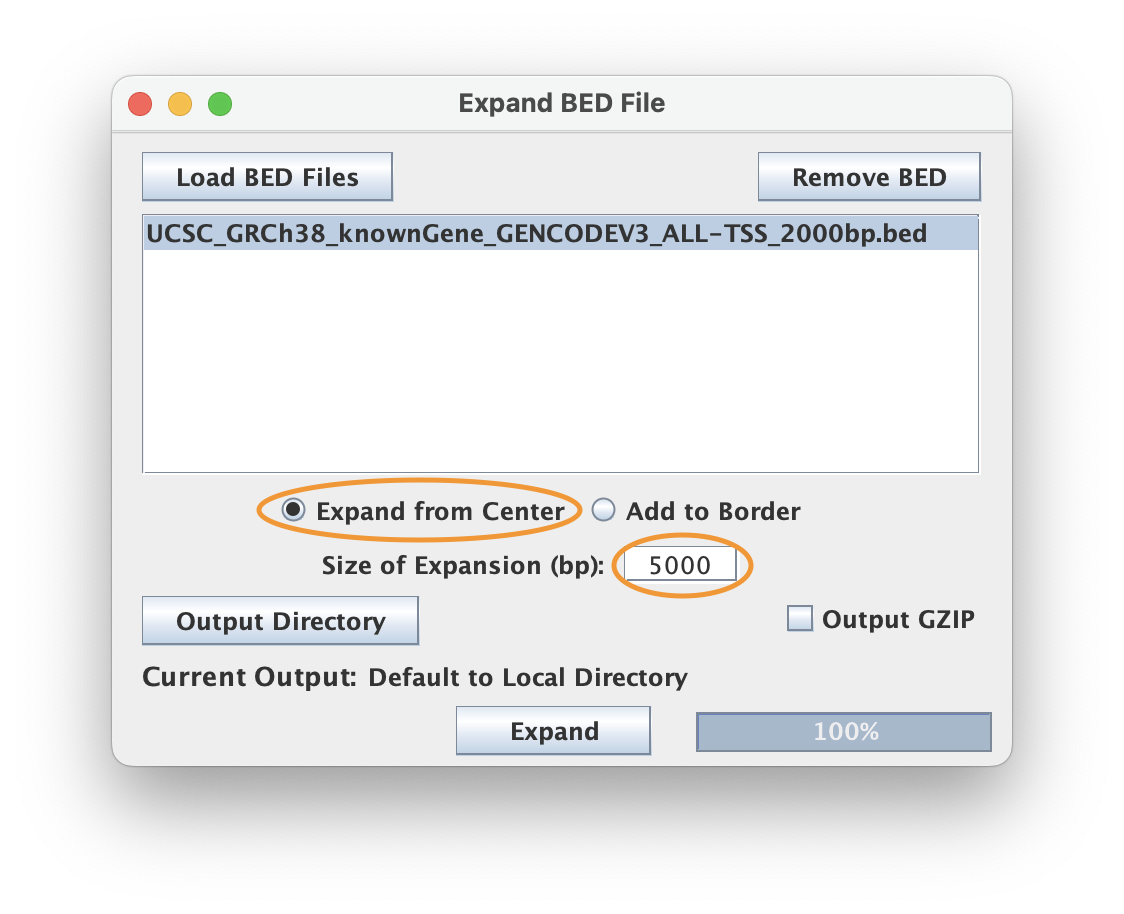

5. Generate the tag pileup
Use TagPileup to pileup the BAM data within a set of BED coordinate windows to generate the composite plot and the matrix(CDT) files that will be used to generate the heatmaps.
5.1. Navigate to Sequence Read Analysis ➡️ Tag Pileup

5.2. Load the BED and BAM files
5.3. Use "Full Fragment" in the top right, then select "Combined" color , "Output Composite", "CDT", and "Output GZIP". Then, proceed to "Output Directory".
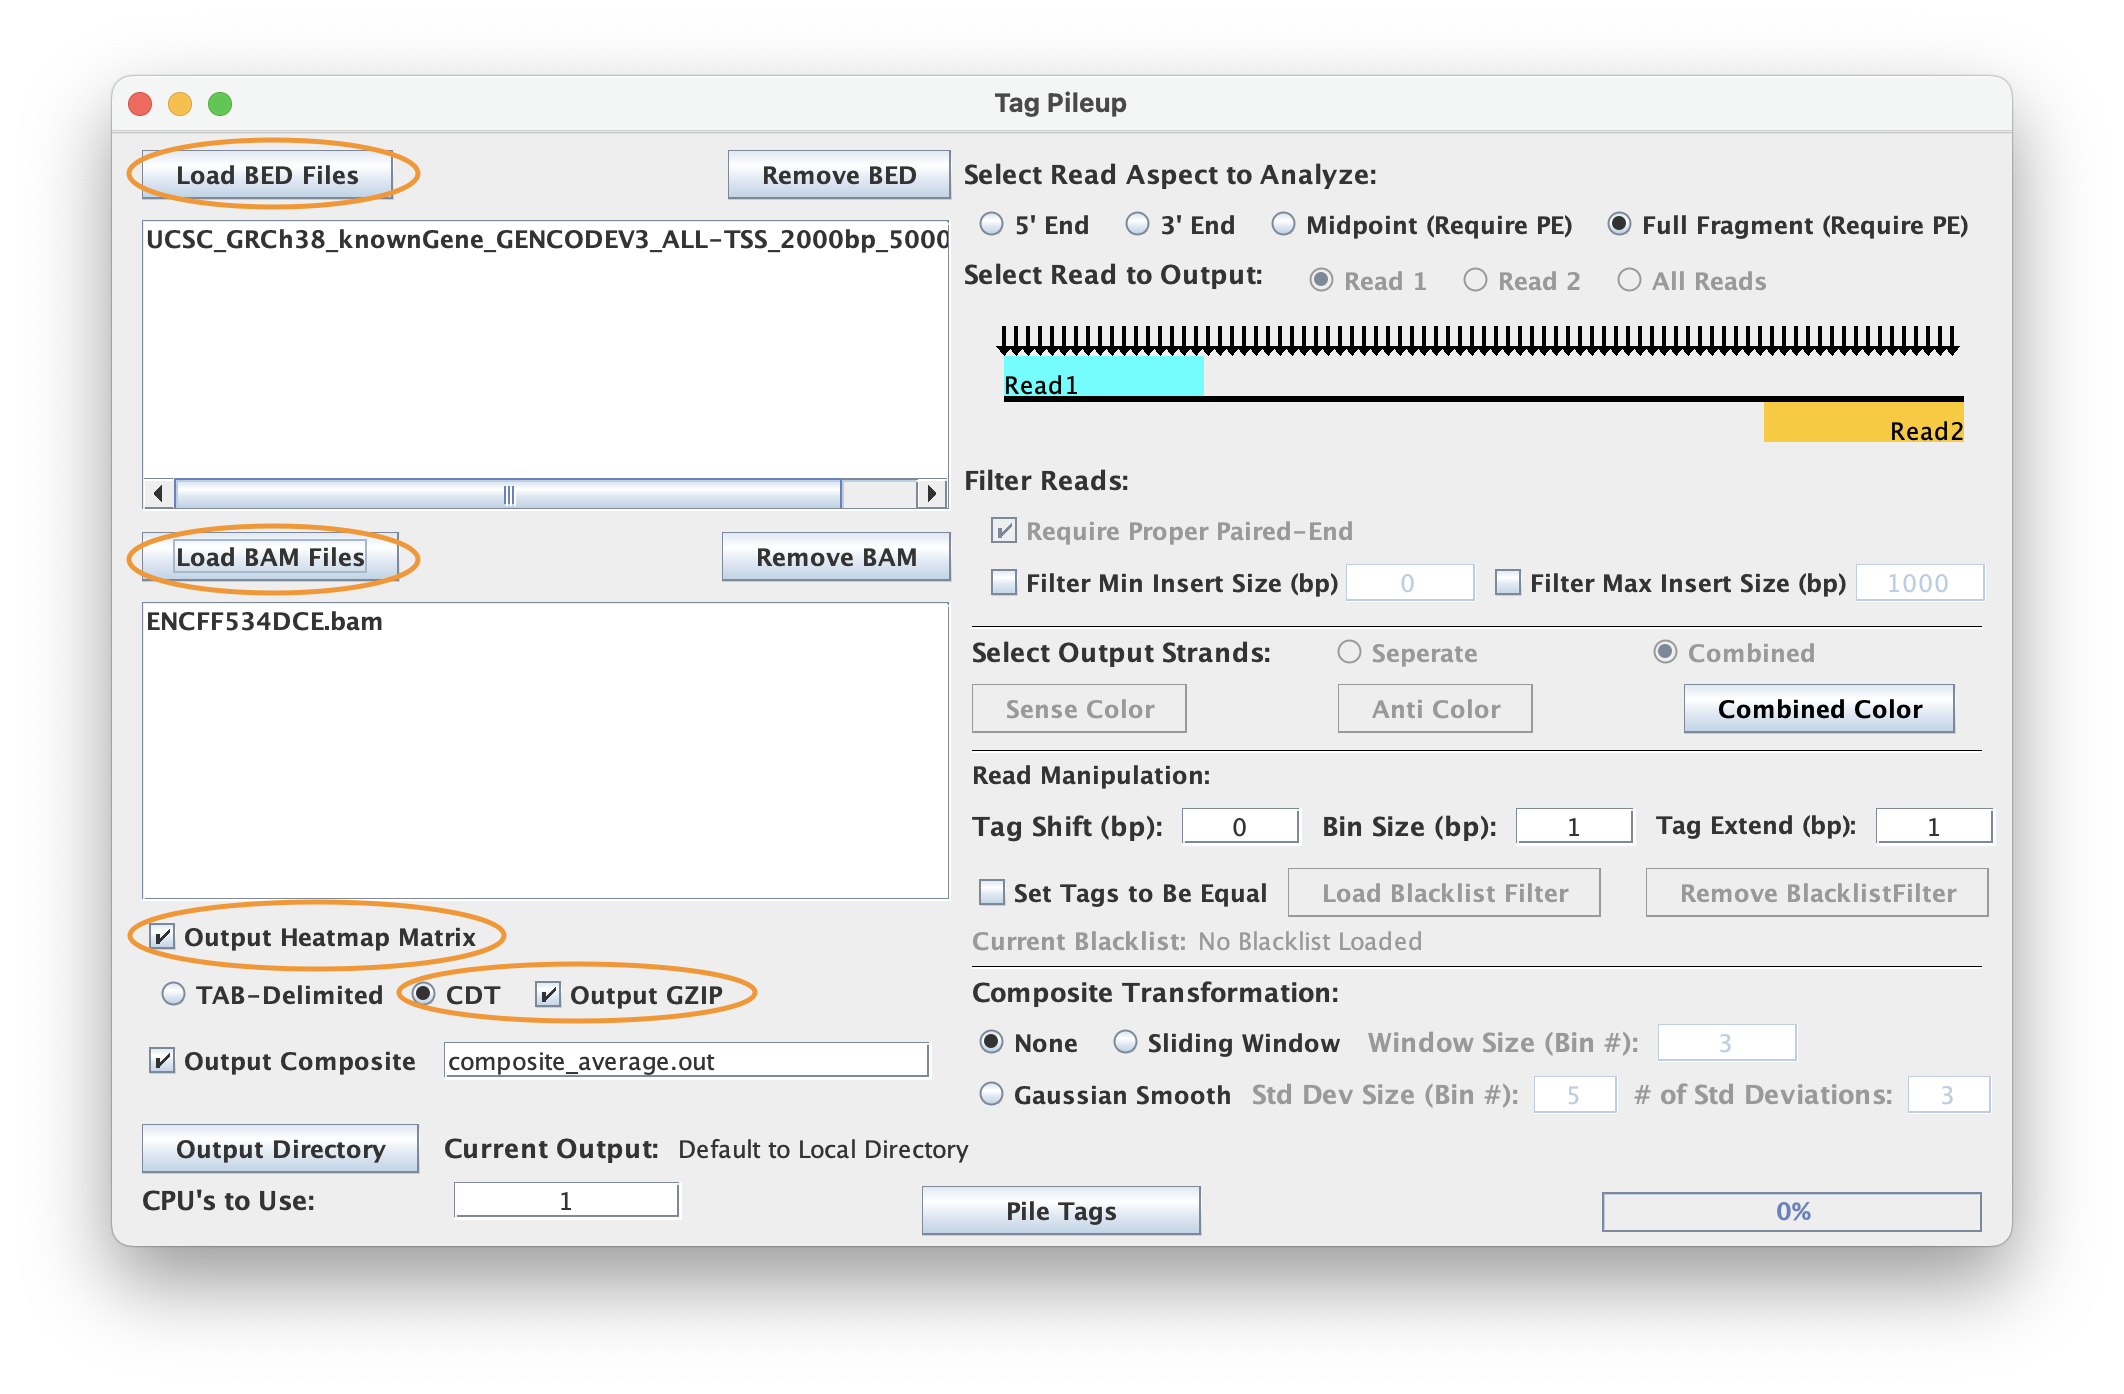
5.4. When ready, select ‘Pile Tags’ to execute
The default parameters Tag Pileup is set to expect is a sequence-specific strand separated Atac-seq dataset. Modifications to these parameters are needed for more specific analysis or when using data generated from other assays.
5.5. Save composite results as PNG
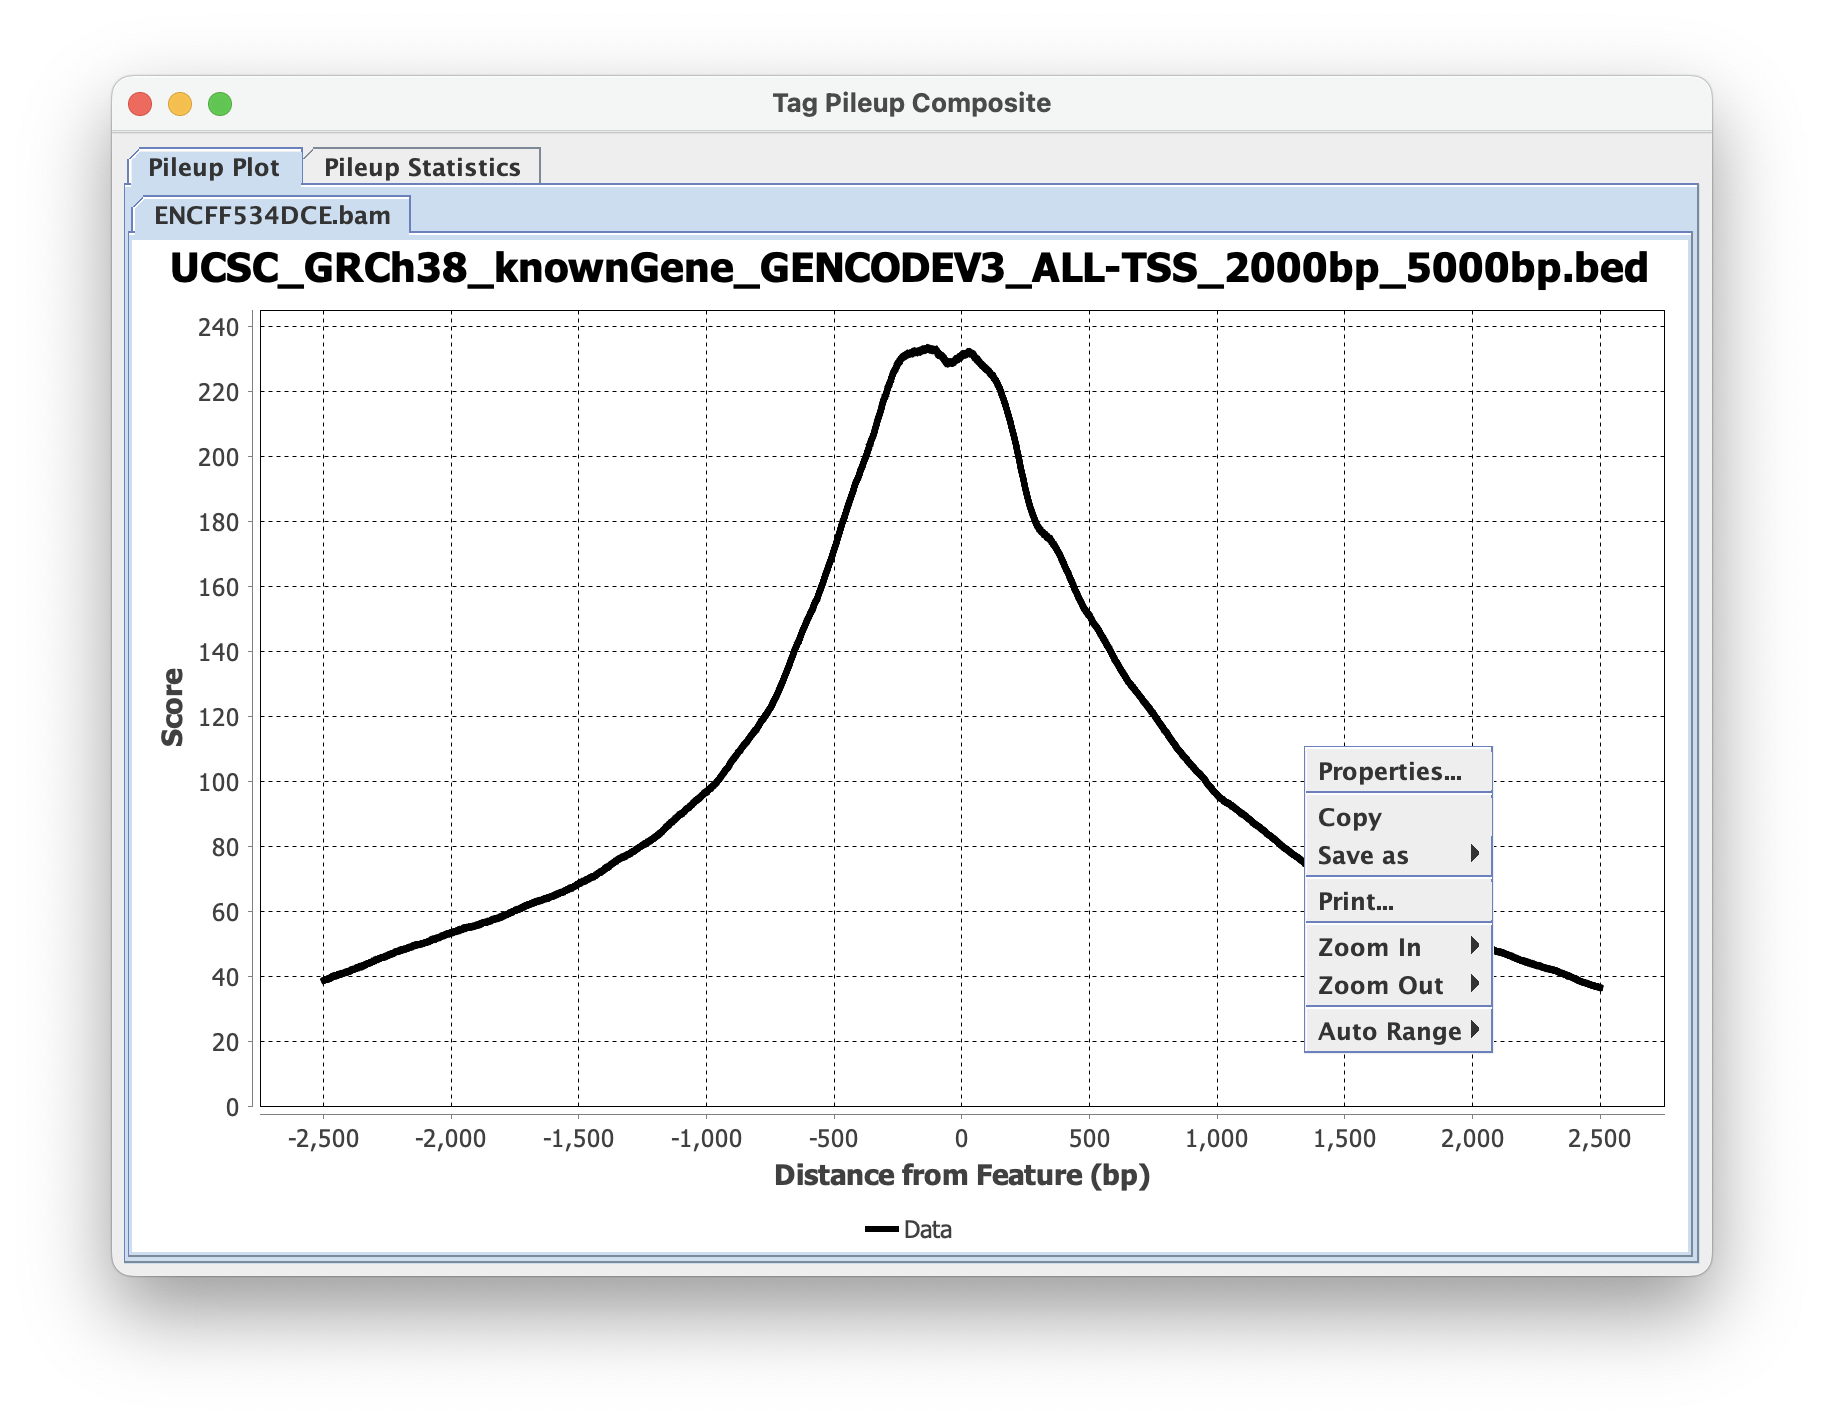
The displayed composite plot can be modified by right-clicking and selecting properties. Things such as axis labels, axis range, and colors can be modified here.
The final image can then be saved by right-clicking and selecting ‘Save as’. PNG is fine for most cases, but SVG is strongly recommended if this composite plot will be used in Adobe Illustrator later.
Besides the composite plot image, ScriptManager has saved the matrix *.cdt files to your Output Directory together with the composite plot values file (If you didn't change the name it would be called composite_average.out). These CDT files will be used as the input for generating heatmaps in the next step.
6. Sort BED file by CDT file
Use Sort BED files by CDT to sort the entries based on chromosome name (C), followed by the start position (D), and then by the end position (T).
6.1. Navigate to Coordinate File Manipulation ➡️ Sort BED.

6.2. Load BED & CDT File from Tag Pileup
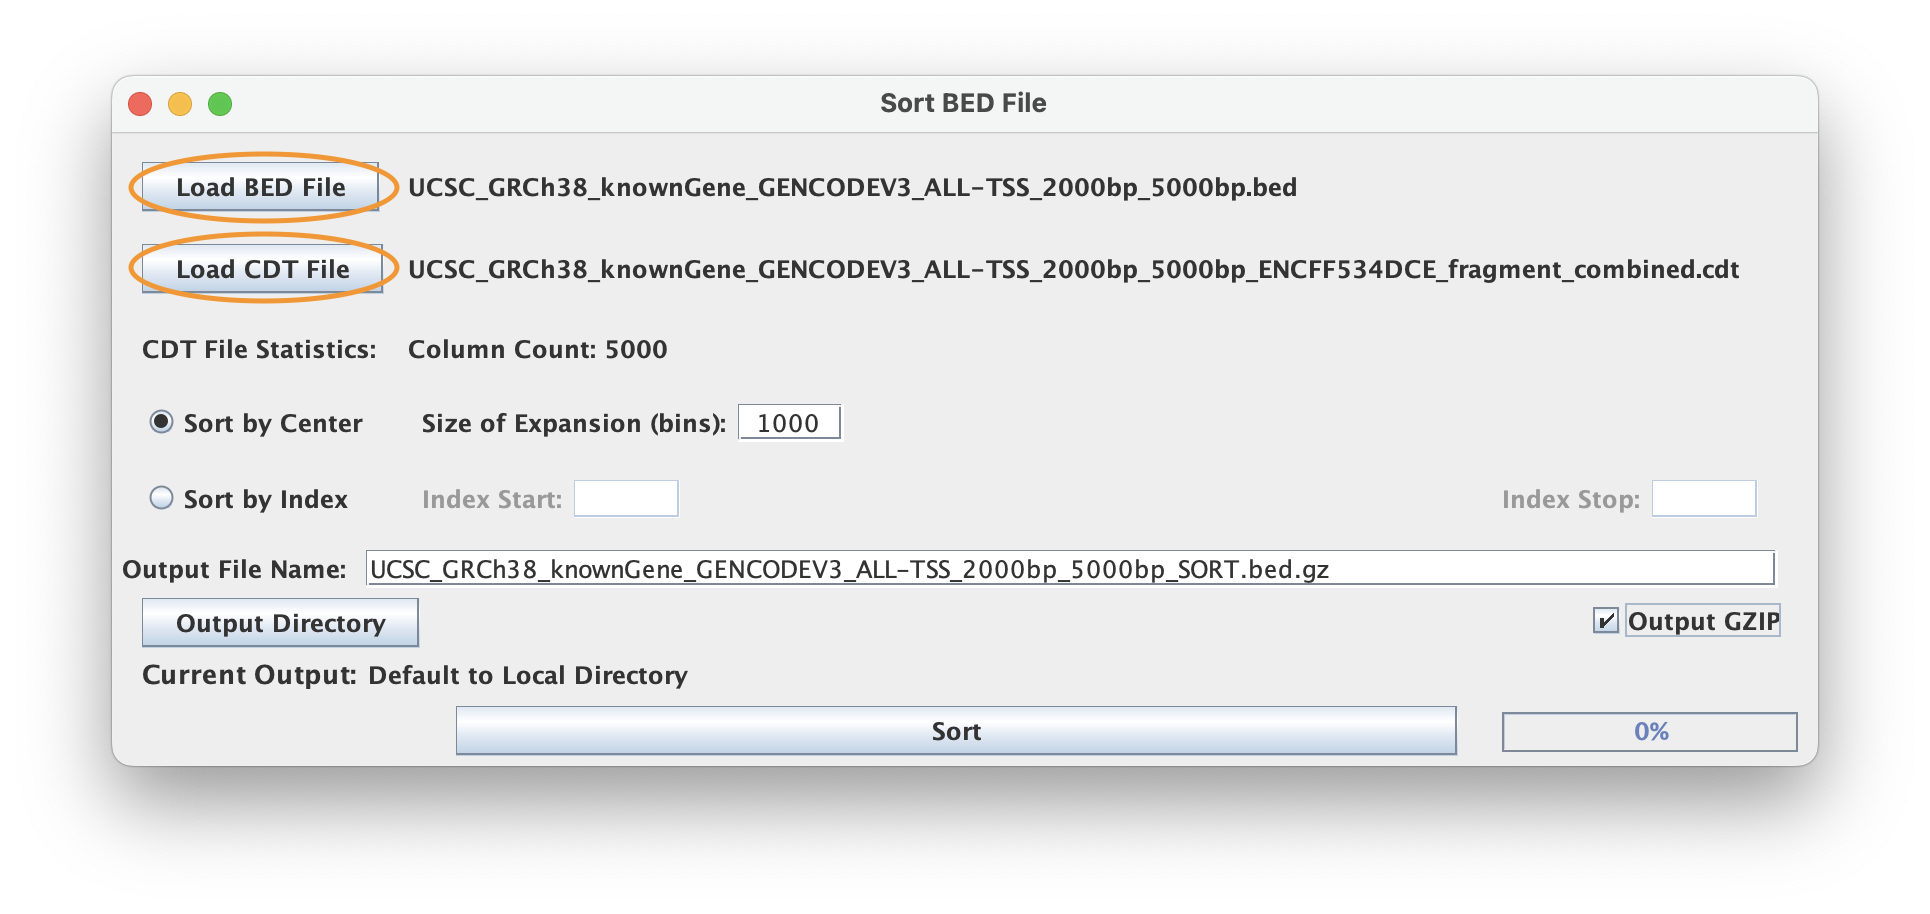
6.3. Change Expansion Size to 1000 from Center
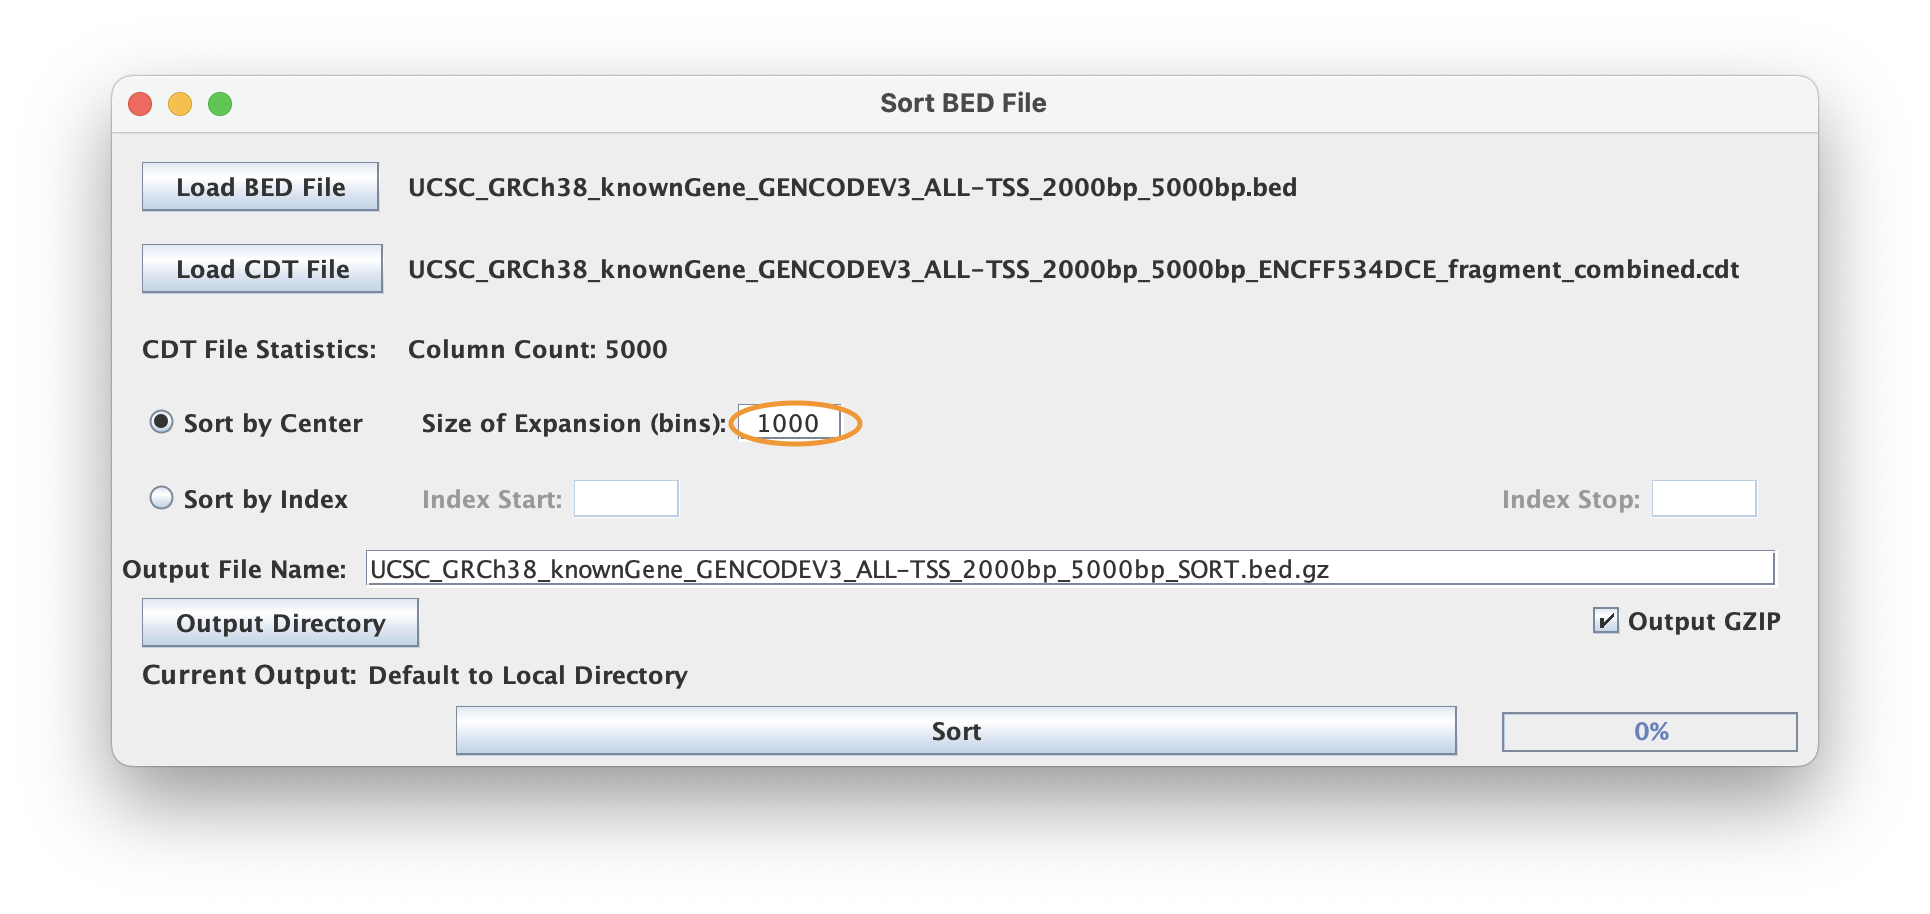
6.4. Select Base Output File Name for sorted BED & CDT Files

7. Generate Heatmaps
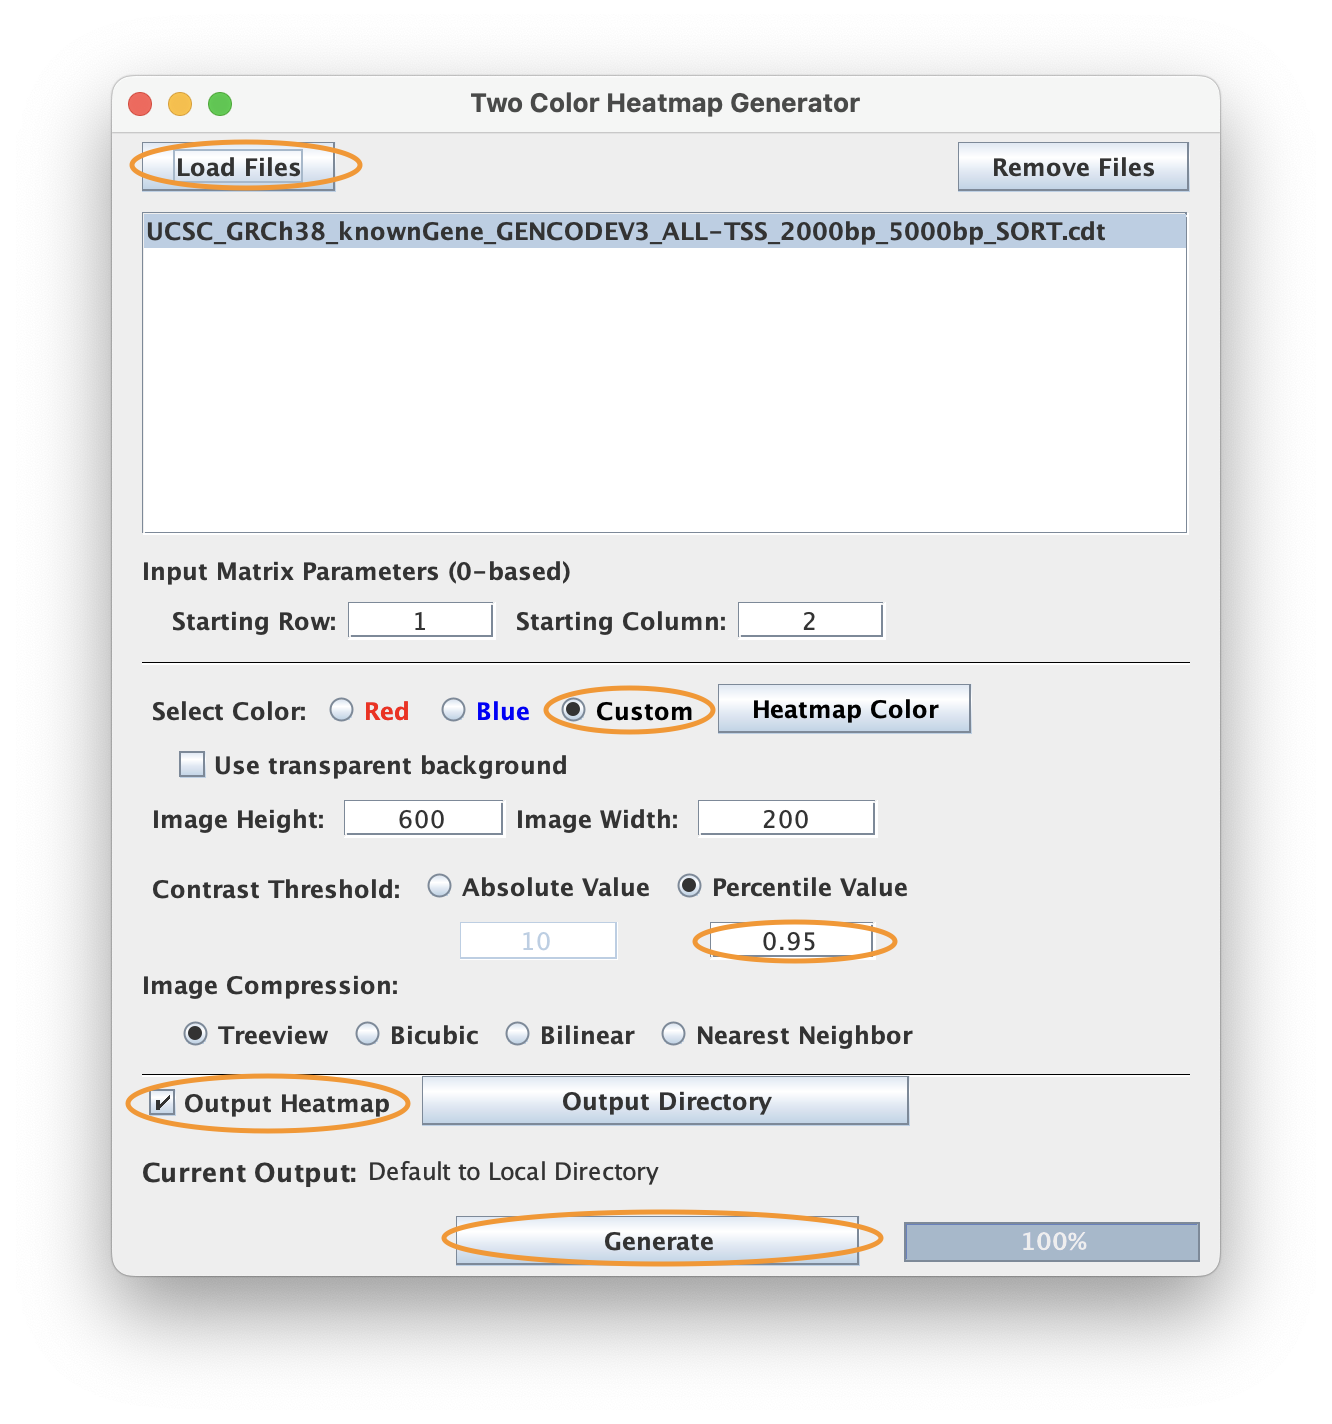
7.1. Navigate to Figure Generation ➡️ Heat Map.

7.2. Load the sorted CDT file
7.3. Select "Custom" for color, and change the Contrast Threshold to "Percentile Value".The heatmaps for this dataset show the best contrast when using the default "Percentile Threshold" value (.95 or 95%).
7.4. Click the "Output Heatmap" checkbox. The Heatmap generator does not save the produced PNG by default.
7.5. Click "Generate" to save your PNG heatmap!

Command-Line shell script
The following shell commands records the locations for a BED file, a BAM file, and the anticipated OUTPUT basename as environmental variables to derive the corresponding composite plot values and heatmaps. This can serve as a template for you to write out your own workflows as bash scripts that execute command-line style ScriptManager.
SCRIPTMANAGER=/path/to/ScriptManager.jar
BEDFILE=/path/to/UCSC_GRCh38_knownGene_GENCODEV3_ALL-TSS_2000bp.bed
BAMFILE=/path/to/ENCFF128WZG.bam
OUTPUT=/path/to/myoutput

samtools index $BAMFILE

java -jar $SCRIPTMANAGER bam-statistics pe-stat $BAMFILE -o $OUTPUT
java -jar $SCRIPTMANAGER coordinate-manipulation expand-bed -c 5000 $BEDFILE -o $OUTPUT\_5000bp.bed
java -jar $SCRIPTMANAGER read-analysis tag-pileup --combined --full-fragment $OUTPUT\_5000bp.bed $BAMFILE -o $OUTPUT\_composite.out -M $OUTPUT\_matrix
java -jar $SCRIPTMANAGER coordinate-manipulation sort-bed -c 1000 $OUTPUT\_5000bp.bed $OUTPUT\_matrix_combined.cdt -o $OUTPUT\_SORT
java -jar $SCRIPTMANAGER figure-generation heatmap -p .95 --black $OUTPUT\_SORT.cdt -o $OUTPUT\_heatmap.png

# Output files:
#  - /path/to/myoutput_InsertHistogram.out
#  - /path/to/myoutput_PE.png
#  - /path/to/myoutput_5000bp.bed
#  - /path/to/myoutput_composite.out
#  - /path/to/myoutput_matrix_combined.cdt
#  - /path/to/myoutput_SORT.bed
#  - /path/to/myoutput_SORT.cdt
#  - /path/to/myoutput_heatmap.png