Genomic Features Tutorial
Generating four-color plots to compare positional sequence content across genomic sites
Goal: This tutorial provides a guide to generating a four-color plot using the ScriptManager platform and the data generated by the Yeast Epigenome project. These plots are especially great for showing the binding motifs within the ChIP-exo peaks of sequence-specific transcription factors.

Download ScriptManager (v0.14):
The current version of ScriptManager is available for download here. Make sure you have Java installed.
The file ScriptManager-v0.14.jar should be placed someplace locally accessible. For example on Mac OS on the Desktop (Permissions will need to be accepted) or someplace in your home directory (i.e. Macintosh HD/Users/userID/ScriptManager)
Download data
You need one set of genomic coordinate regions to investigate (BED) and the reference genome sequence (FASTQ) to complete this exercise. Read more about the BED/FASTA file formats here.
BED File
This is the set of Reb1 binding sites from Rossi et al (2018).
Download sample BED fileIf your BED file downloads with a .txt extension, make sure to change the filename to a .bed extension. For this tutorial, the BED file is named Reb1_Rhee_primary_sites_975.bed.
FASTA Genome sequence
You will also need the reference genome for yeast (sacCer3).
Download sacCer3 genome (FASTA)🚧 👷♀️ UNDER CONSTRUCTION 👷 🚧
The downloaded genome linked here uses r numerals for the chromosome names. Below are some links to scripts that will help you convert them to the arabic numeral names that the downloaded BED file is based on.
Turn this script into an easier-to-run way to get the reference genome with arabic numerals. Your own sacCer3.fa genome should work in this tutorial if you use the chr1 chr2 chr3 ... naming system, not the chrI chrII chrIII ....
Generate the Four-color Plot
1. Open ScriptManager
- MacOS
- Linux
- Windows
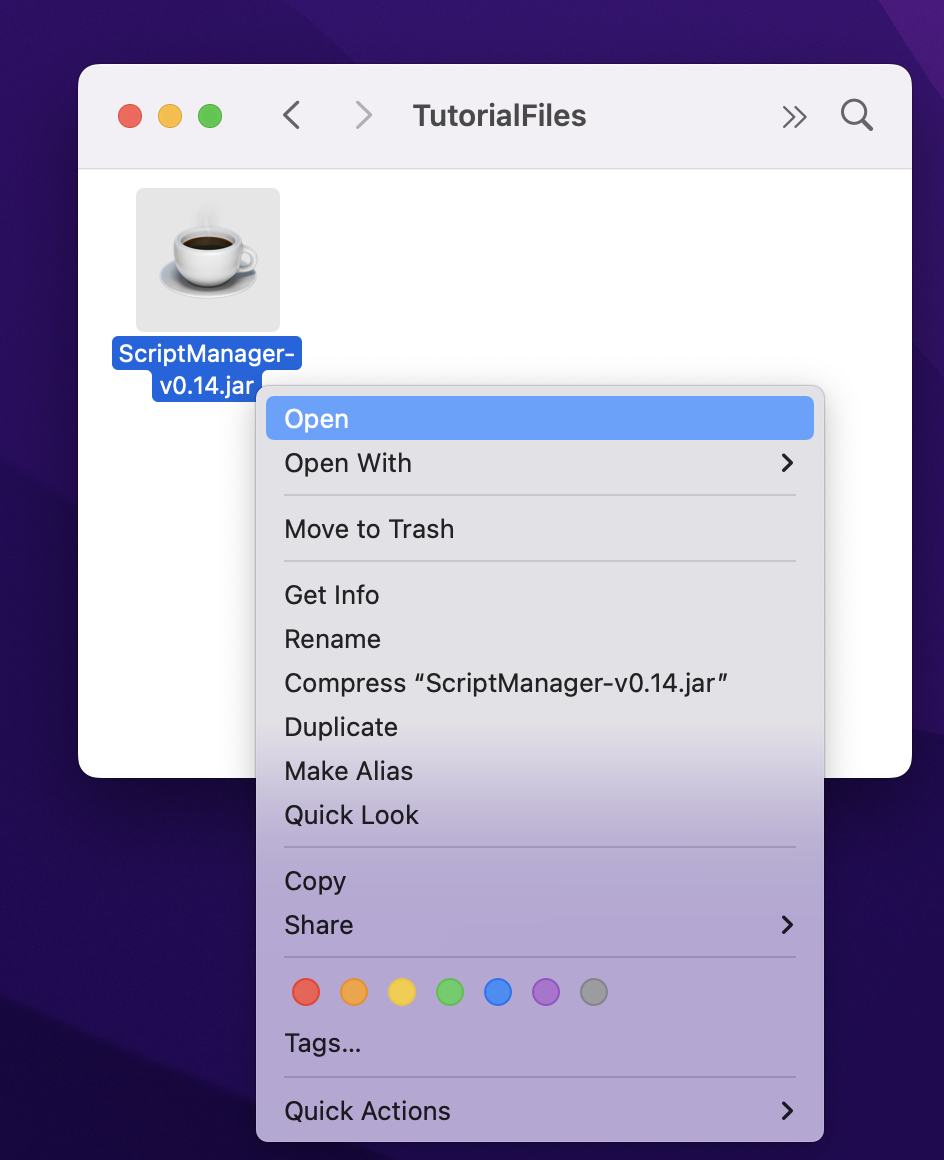
Depending on your system permissions, you may need to be an administrator to open this for the first time. On Mac systems, this can be done by right-clicking the file and selecting ‘Open’ at the top.

Some MacOS systems may not properly open the JAR by simply double-clicking on the JAR file so you may need to open your Terminal window and execute it from the command line by executing the jar file without any arguments or flags:
java -jar /path/to/ScriptManager.jar
If you're not sure how to type the path to ScriptManager, you can type java -jar (end with space) and then drag ScriptManager from Finder into your Terminal window and then press enter.
Double-click or right-click the ScriptManager JAR file to start the program.

Double-click or right-click the ScriptManager JAR file to start the program.

Once you see the main tool selection window, you're off to the races!
2. Resize the Reb1 motif-aligned BED file
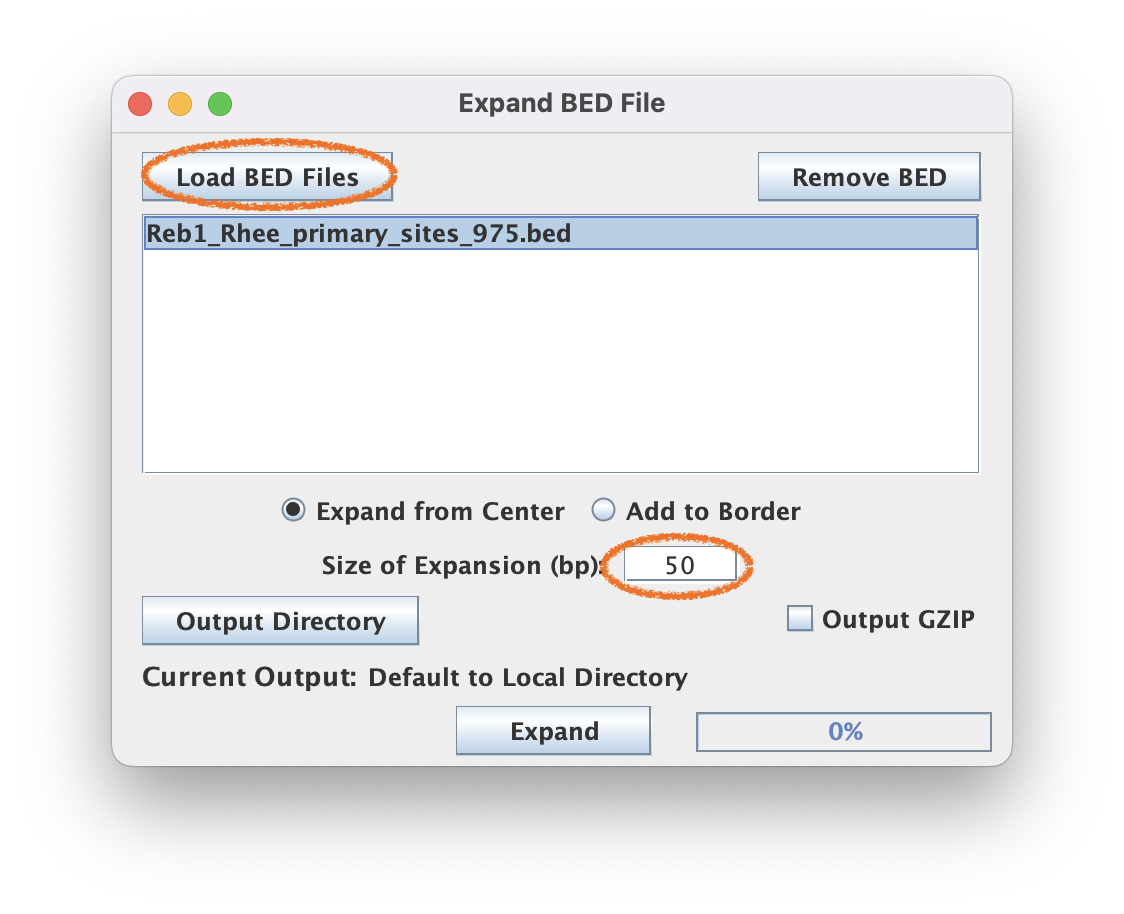
The BED file is the set of reference coordinates that your heatmap and composite plots will be aligned to, but you’ll need to specify how far upstream and downstream you want your data to be plotted; i.e., “Size of Expansion (bp). If you bed file is defined by more than a 1 bp interval AND you want to add to limits of that interval, then select “Add to Border”).
2.1. Navigate to Coordinate File Manipulation ➡️ Expand BED File

2.2. For this tutorial, use the 50bp expansion and select "Expand from Center".


BED file coordinates often need to be resized for more informative tag pileups. As a factor that binds a short motif, Reb1 does not require a large window size to visualize the motif sequence. In fact, a wider window will make it harder to visualize the stripes of color around the motif.
3. Generate the FASTA sequence input
3.1. Navigate to DNA Sequence Analysis ➡️ FASTA from BED to create the input for generating a Four Color plot.

3.2. Load the FASTA file containing the Genome FASTA
- A *.fai file will be generated for the genome file the first time it is used. If the Genome FASTA file is NOT in proper FASTA format the script will fail
3.3. Load appropriate BED file for sequence FASTA generation.


3.4. Click "Calculate" to start the extraction which outputs a FASTA file
4. Generate the Four color sequence image
4.1. Navigate to Figure Generation ➡️ Four Color Plot to generate the plot once you have generated the FASTA file of the sequences within the BED regions.

4.2. Load the FASTA file containing the FASTA sequences (generated in step 2).
At this point you may opt to resize the pixel dimensions of each nucleotide rectangle or customize the colors corresponding to each nucleic acid base.
4.3. Click "Generate" to execute the script.


Tah dah! You've made the four color plot! It's kind of tall but you can resize it in your favorite image editing software.
Command-Line shell script
The following shell commands takes a BED file and a FASTA file of the full genomic sequences to generate a four-color sequence plot of the center 50bp nucleotides in each BED coordinate interval.
and the anticipated OUTPUT basename as environmental variables to derive the corresponding composite plot values and heatmaps. This can serve as a template for you to write out your own workflows as bash scripts that execute command-line style ScriptManager.
SCRIPTMANAGER=/path/to/ScriptManager.jar
GENOME=/path/to/sacCer3.fa
BEDFILE=/path/to/Reb1_Rhee_primary_sites_975.bed
OUTPUT=/path/to/myfourcolorplot.png

java -jar $SCRIPTMANAGER coordinate-manipulation expand-bed -c 50 $BEDFILE -o BED_50bp.bed
java -jar $SCRIPTMANAGER sequence-analysis fasta-extract $GENOME BED_50bp.bed -o BED_50bp.fa
java -jar $SCRIPTMANAGER figure-generation four-color BED_50bp.fa -o $OUTPUT

rm BED_50bp.bed BED_50bp.fa

# Output files:
#  - /path/to/BED_50bp.fa
#  - /path/to/myfourcolorplot.png