Tag Pileup

Pileup 5' ends of aligned tags given BED and BAM files according to user-defined parameters
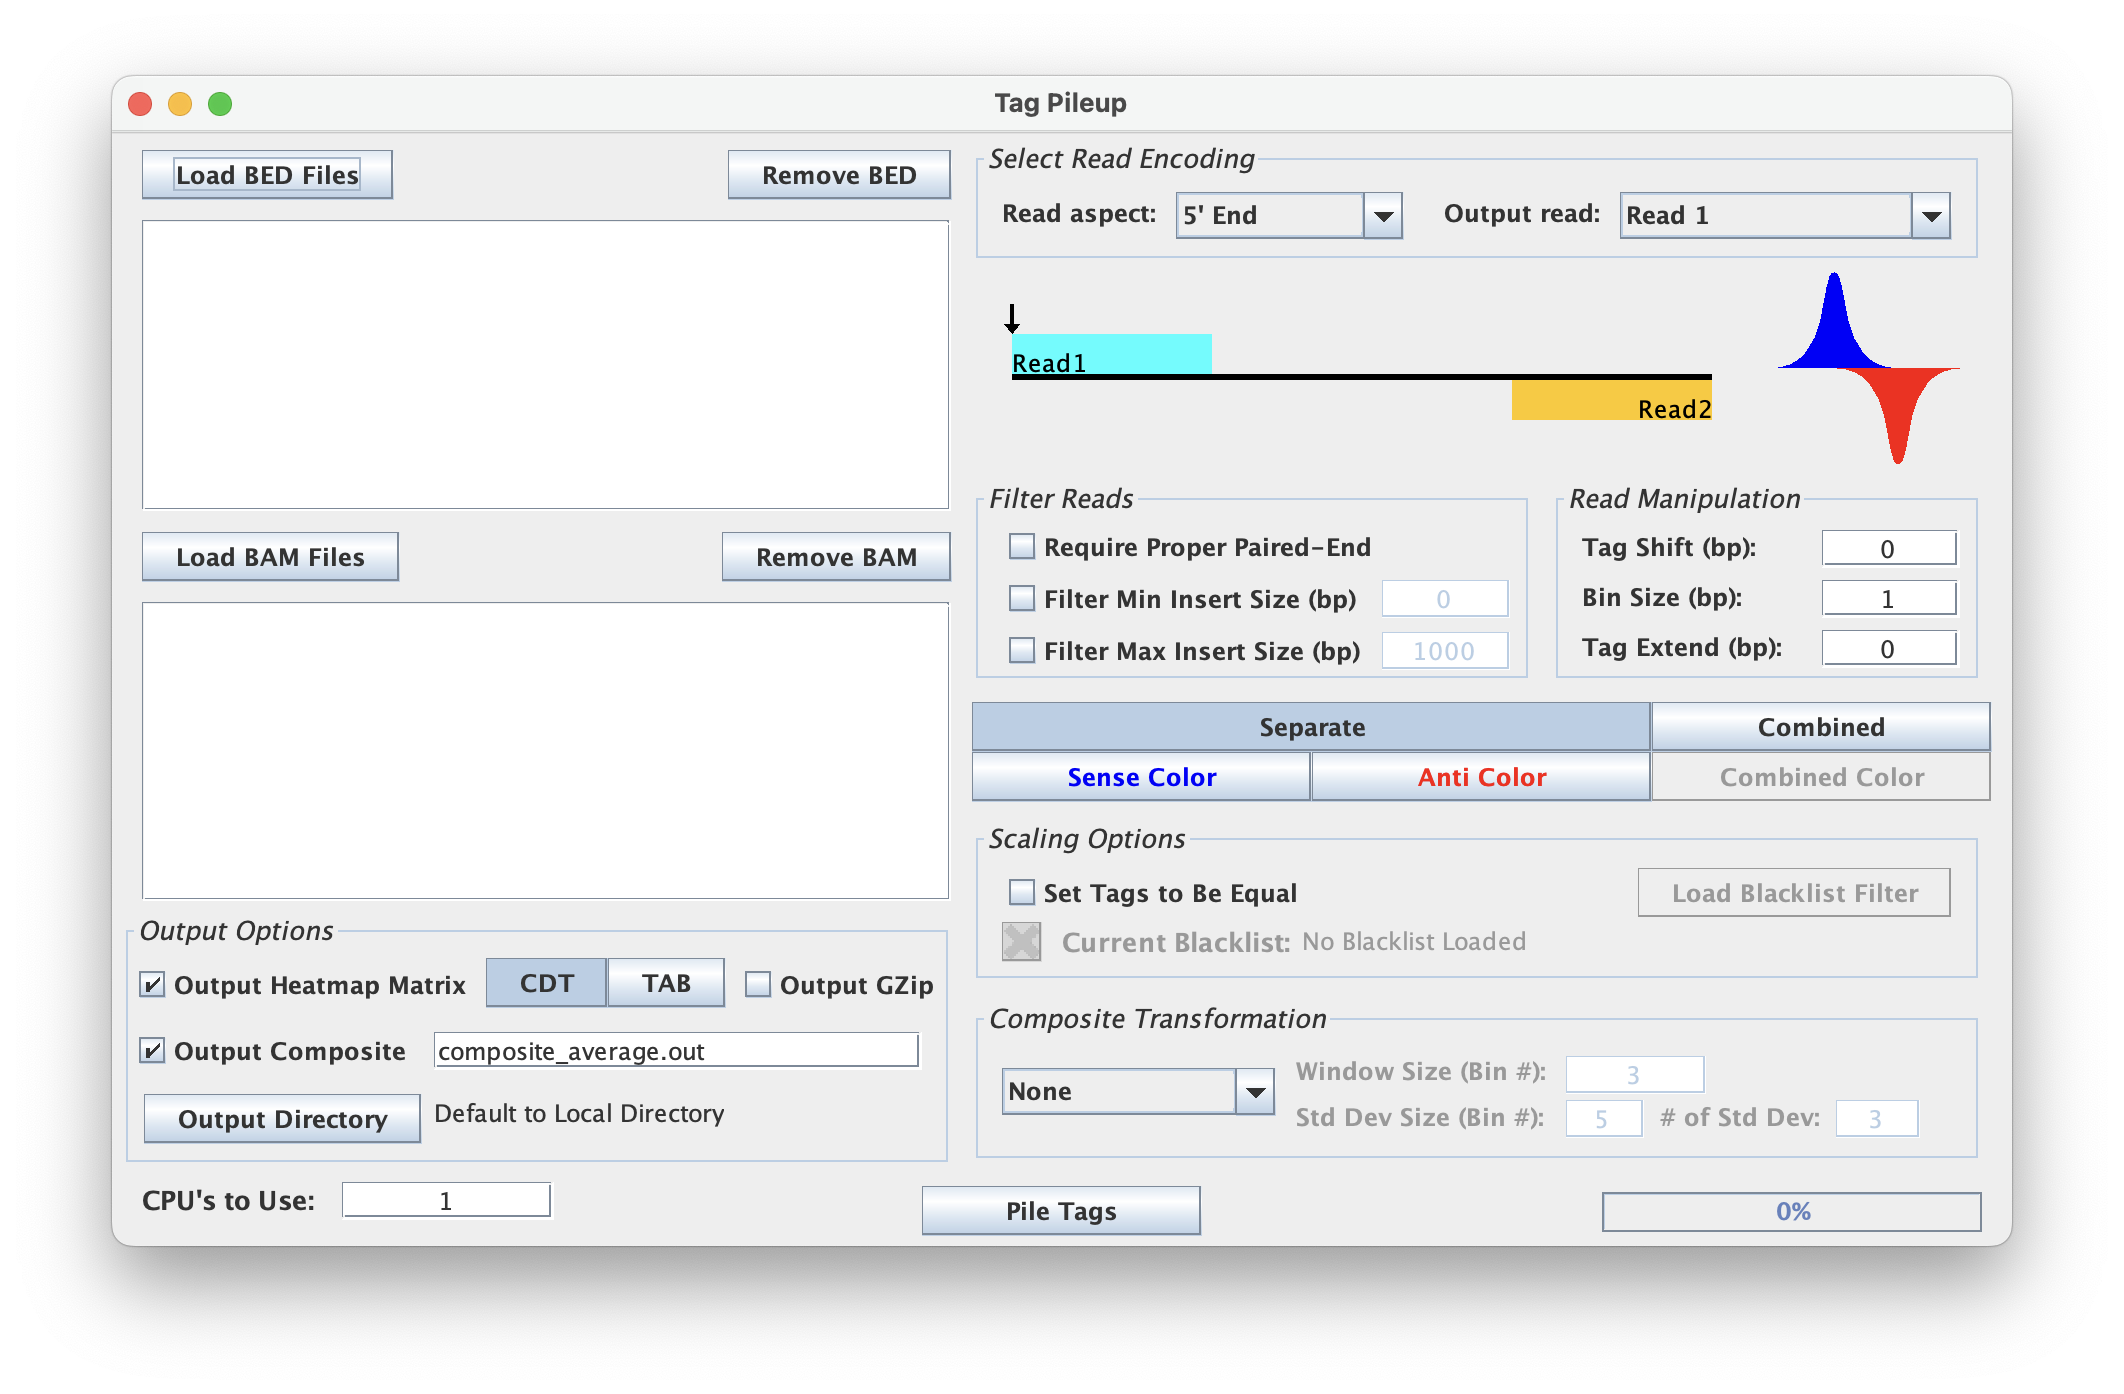
The TagPileup tool is used to look at read density across a bed file. This tool has perhaps the most complex option structure of the ScriptManager tools.
File inputs (BAM & BED)
This script processes BAM-type files so make sure your input is properly formatted and uses the appropriate .bam extension. The script also supports bulk selection and processing of files.
This script also processes BED-type files so make sure your input is properly formatted and uses the appropriate .bed or .bed.gz extension. The script also supports bulk selection and processing of files.
Output Matrix Options (CDT/TAB)
This script outputs a heatmap matrix in CDT format by default. The script can also output a matrix in tab format. For visualizing the output matrix, see Two-color Heatmap tool.
Output GZip
Toggling this allows the user to write matrix files to a compressed file format using a general compression format (gzip) which has the advantage of speeding up the execution time by shrinking the I/O load.
Output Composite Options (TXT)
This script outputs a composite plot from the composite data. See the Composite Plot tool for more details.
When using the CLI, see composite-plot to generate the composite plot image similar to the GUI output window.
Read Aspect & Type
This tool has multiple read aspects to choose from.
- 5' End: analyze the 5' end of the given read
- 3' End: analyze the 3' end of the given read
- Midpoint: analyze the midpoint between two reads
- Full Fragment: analyze the full fragment of two reads
Note: The Midpoint and Full Fragment options require proper paired-end reading.
For the 5' End and 3' End options, the tool also provides the selection to analyze Read 1, Read 2, or All Reads.
Filter Options
- Require Proper Paired-End refers to the proper pairing of reads Read 1 and Reads 2.
- Filter Min Insert Size (bp) refers to the minimum insert size to filter
- Filter Max Insert Size (bp) refers to the maximum insert size to filter
Strand Options
Depending on the type of dataset or analysis the user seeks, the tool provides options for both a strand separated output and a combined strand output. For a strand separated output, the strand colors default to the ChIP-exo standard, blue for 'Sense' and red for 'Anti'.
Read Manipulation
The user can shift the aligned tags by indicating the number of base pairs to be shifted by in the 'Tag Shift' box. The genomic bin size can also be adjusted to simplify the composite plot visualization.
Composite Transformation (Smoothing options)
There are three available options for smoothing:
- No smooth
- Window smooth
- Gaussian smooth
For the window smoothing, you can indicate a window size for applying the sliding window for smoothing with an integer. This integer indicates the number of bins per window (bins defined and explained in the "Calculation Options"). You can use the -w flag as a shortcut for the GUI version default value of 3.
For the gaussian smoothing, you can think of the standard deviation size as the
<image-of-gaussian-equation>
Calculation Options
A bin refers to the bioinformatics strategy of "binning" genomic fragments, i.e., grouping fragments together so that distributions can be easier to analyze.
- Window Size: indicate a number of bins per window for window smoothing
- Std Dev Size: indicate a standard deviation size for gaussian smoothing
- # of Std Deviations: indicate a number of standard deviations for gaussian smoothing
Composite plot figure
Once the composite plot has been generated via a pop-up window, the plot can be modified by right-clicking the figure and selecting "Properties". The final image can also be saved by selecting "Save as". It is recommended to save the plot as an SVG file if the plot will be used in Adobe Illustrator.
Command Line Interface
Usage:
java -jar ScriptManager.jar read-analysis tag-pileup [-5 | -3 | -m | --full-fragment]
[-1 | -2 | -a] [-N | -w | -W=<winVals> | -g | -G=<gaussVals> <gaussVals>
[-G=<gaussVals> <gaussVals>]...] [-dhptVz] [--cdt] [--combined] [--tab]
[-M[=<outputMatrix>]]... [-b=<binSize>] [--cpu=<cpu>] [-e=<tagExtend>]
[-f=<blacklistFilter>] [-n=<MIN_INSERT>] [-o=<outputComposite>]
[-s=<shift>] [-x=<MAX_INSERT>] <bedFile> <bamFile>
The TagPileup tool is used to look at read density across a bed file. This tool has perhaps the most complex option structure of the ScriptManager tools.
The help guide groups the options by their relation to different aspects of ScriptManager:
Positional Inputs
| Option | Description |
|---|---|
bedFile | The BED file with reference coordinates to pileup on. |
bamFile | The BAM file from which we remove duplicates. Make sure it's indexed! |
General Options
| Option | Description |
|---|---|
-d, --dry-run | print all parameters without running anything |
Output Options
| Option | Description |
|---|---|
-o, --output-composite=<outputComposite> | specify output file for composite values |
-M, --output-matrix[=<outputMatrix> ] | specify output basename for matrix files (files each for sense and anti will be output) |
-z, --gzip | output compressed output (default=false) |
--cdt | output matrix in cdt format (default) |
--tab | output matrix in tab format |
Read Options
| Option | Description |
|---|---|
-1, --read1 | pileup of read 1 (default) |
-2, --read2 | pileup of read 2 |
-a, --all-reads | pileup all reads |
-m, --midpoint | pile midpoint (require PE) |
Strand Options
| Option | Description |
|---|---|
--separate | select output strands as separate (default) |
--combined | select output strands as combined |
Composite Transformation/Smoothing Options
| Option | Description |
|---|---|
-N, --no-smooth | no smoothing applied to composite (default) |
-w, --window-smooth | sliding window smoothing applied to composite using default 3 bins for window size |
-W, --window-values=<winVals> | sliding window smoothing applied to composite with user specified window size (in #bins) |
-g, --gauss-smooth | gauss smoothing applied to composite using default values: 5 bins and 3 standard deviations |
-G, --gauss-values=<gaussVals> <gaussVals> | gauss smoothing applied to composite with user specified standard deviation(SD) size (in #bins) followed by the number of SD |
Calculation Options
| Option | Description |
|---|---|
-s, --shift=<shift> | set a shift in bp (default=0bp) |
-b, --bin-size=<binSize> | set a bin size for the output (default=1bp) |
-t, --standard | set tags to be equal (default=false) |
--cpu=<cpu> | set number of CPUs to use (default=1) |
Filter Options
| Option | Description |
|---|---|
-f, --blacklist-filter=<blacklistFilter> | specify a blacklist file to filter BED by, must use with -t flag |
-p, --require-pe | require proper paired ends (default=false), automatically turned on with any of flags -mnx |
-n, --min-insert=<MIN_INSERT> | filter by minimum insert size in bp, require PE (default=no minimum) |
-x, --max-insert=<MAX_INSERT> | filter by maximum insert size in bp, require PE (default=no maximum) |
Composite Plot Figure
For visualizing composite data like the GUI window, you need to use a separate tool in the CLI tools. See Composite Plot tool.