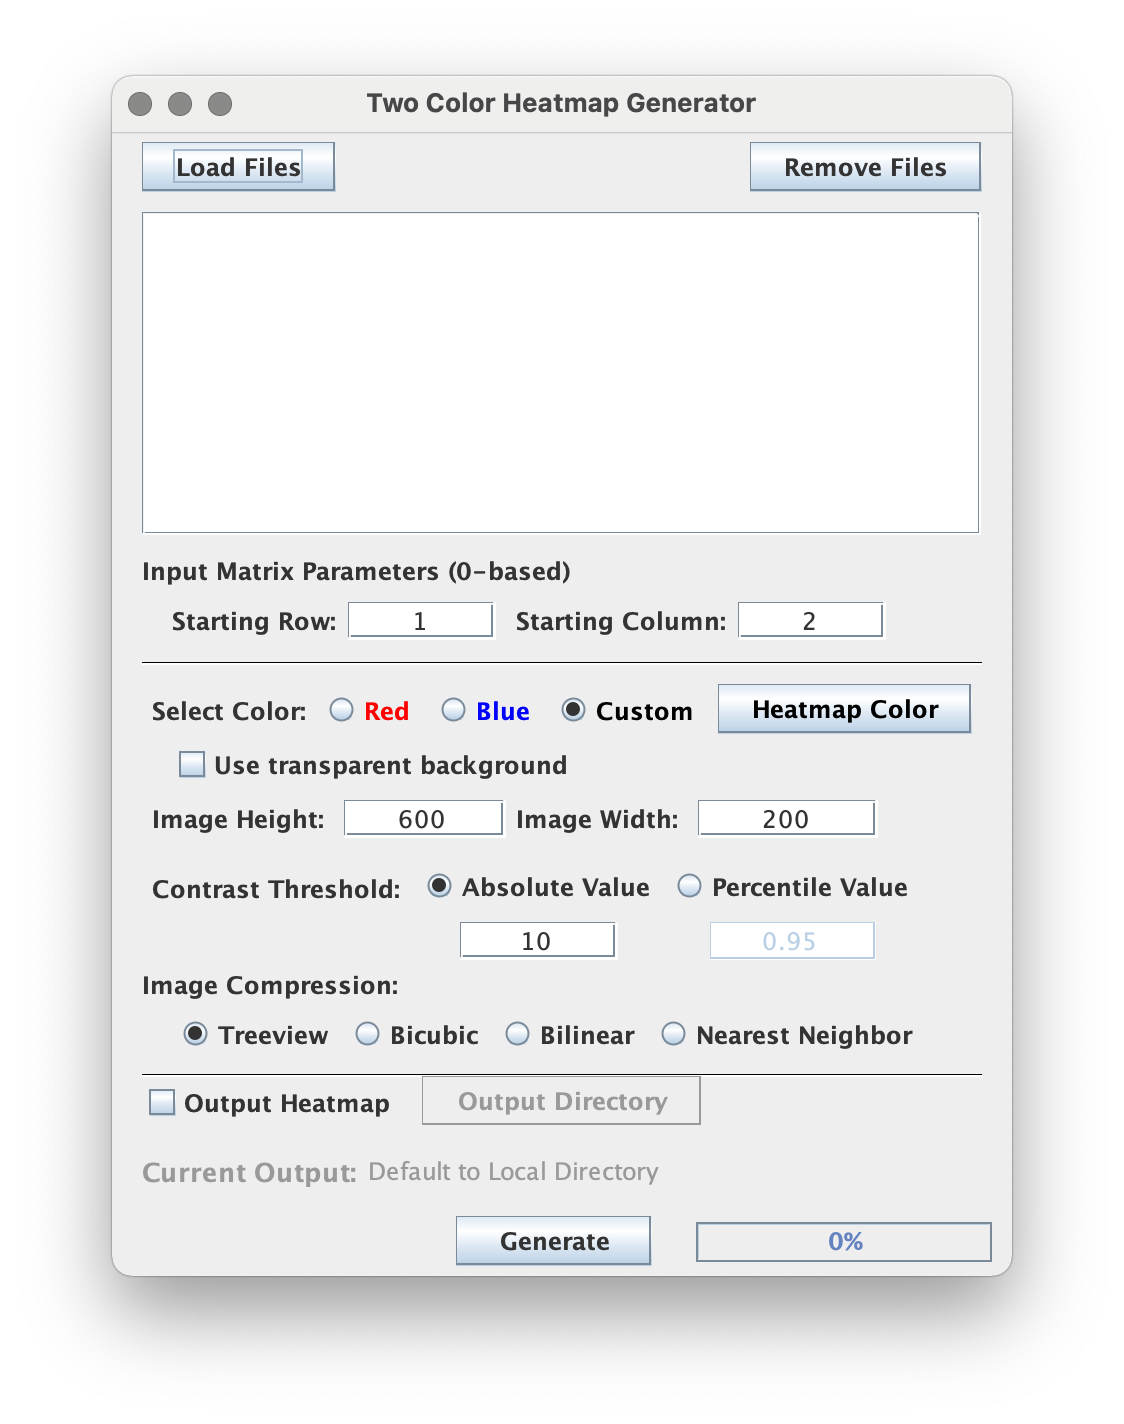
Two-color Heatmap
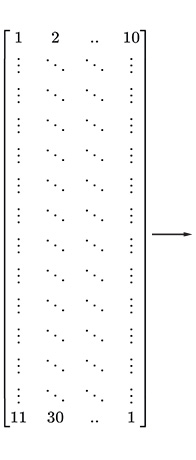
This tool generates a heatmap from a tab-delimited matrix input of numeric values.
The values to color scale is defined as a range from a minimum value of 0 (designated white) to a customizable maximum value specified by the user (customizable but typically red, blue, or black), hence, the "two colors" in the "Two Color Heatmap".


--black

--blue

--custom
This tool is typically used for visualizing the matrix output of Tag Pileup to look at the raw tag coverage of any biochemical sequencing assay (ChIP-exo, ATAC-seq, PROcap, etc.). But there are many other tools in ScriptManager like Align BED to Reference that produce output that can be visualized by this tool. Any tab-delimited text file can be used (many third party tools use such outputs) so long as the appropriate start row and start column are specified to skip over header columns and rows.

File inputs
This script does not restrict selection of file inputs because a variety of file extensions may be parsed out for the numeric matrix. The tool supports bulk selection and processing of files.
Color selection
Details of the implementation are described below but typically red and blue are used for "antisense" and "sense" tag counts (respectively) from strand-specific assays and black is used for tag counts of strand non-specific assays such as ATAC-seq and MNase-seq. Users can further select from any RGB color by clicking the "custom" radiobutton and "Heatmap Color" to open the color selection panel to either choose from a palette of colors or input a hexidecimal color code.
The Pugh Lab standard for ChIP-exo heatmap strand colors is ‘Sense’ = blue and ‘Anti’ = red.
Transparent Background
This checkbox was introduced with v0.14 and allows the user to create heatmap traces where the base color scales from transparent instead of white to the user-selected color.
If selecting a transparent background, there is no need to use the Merge Heatmap tool to merge separate "Sense" and "Anti" heatmaps in classic ChIP-exo analysis. Simply overlay the images on a white background.
Contrast threshold
The user can specify the contrast threshold in a couple ways:
- Absolute: The user can directly define the value marking the "maximum color" (any values equal to this or higher will have the RGB value of the color selected in the above section).
- Percentile: Or the user can tell the script to dynamically determine the top percentile of values across the numeric matrix (excluding zeros) and set them all to have the "maximum color" value and scale color assignment for the rest of the values to white from there.
Read more about the contrast threshold below ("Details of color-scaling strategy").
Is your tool outputting a blank heatmap?
Check your contrast threshold -- If you select the default 10 absolute threshold but your matrix contains values of mostly 0, 1, and 2s, you might be getting extremely light, almost white patterns that make your output look like a blank heatmap!
Image dimensions
The image height and width specify the number of pixels to squish or expand the numeric matrix into for the final output .png heat map image.
Image Compression
The image compression options allow the user to choose from several image compression strategies but we recommend "Treeview" for base-pair resolution tag-pileup occupancy data. This is the same strategy implemented by previous microarray visualization packages (Saldanha et al, 2004).
Details of color-scaling strategy
Let every value in the input tab-delimited matrix() be indexed by and . The output heatmap of pixels can be defined by three matrices (, , and ) of the same dimensions similarly indexed by and that define the RGB pixel color at each position.
The first step of the heatmap script is to define the contrast threshold, or value-based ceiling () for the color scale. The user can select this based on an "absolute" strategy or a "percentile" strategy.
Absolute: For this strategy, the user simply specifies the value of directly.
Percentile: For this strategy, the user specifies a percentile value based on the values of the input matrix, .
- Put all the non-zero values of into a sorted list, .
- Identify the value in marking the top percentile.
- Set to this value.
For developers: is the COLOR_RATIO variable in the script's code.
Before proceeding further, we will define the heatmap color selected by the user in RGB values as , , . For example, if the user selected "Red", then , , . If the user selected "black", then , , .
Two-color heatmap also defines white for matrix values corresponding to zero or below, i.e. , , . However in the following equations we will just use for simplicity.
Now the script will build out the heatmap with pixel color values defined as follows:
Command Line Interface
Usage:
java -jar ScriptManager.jar figure-generation heatmap [--black | --red | --blue |
-c=<custom>] [-hV] [-a=<absolute>] [-l=<startCOL>] [-o=<output>]
[-p=<percentile>] [-r=<startROW>] [-x=<pixelWidth>] [-y=<pixelHeight>]
[-z=<compression>] <CDT>
Description:
Generate heatmap using CDT files.
Positional Input
Expects a CDT formatted matrix file of values to generate heatmap from.
Output Options
| Option | Description |
|---|---|
-o, --output=<output> | specify output filename, please use PNG extension (default=CDT filename with "_\<compression-type>. png" appended to the name in working directory of ScriptManager |
Plot Design Options
| Option | Description |
|---|---|
-r, --start-row=<startROW> | |
-l, --start-col=<startCOL> | |
-x, --width=<pixelWidth> | indicate a pixel width for the heatmap (default=200) |
-y, --height=<pixelHeight> | indicate a pixel height for the heatmap (default=600) |
-z, --compression=<compression> | choose an image compression type: 1=Treeview, 2=Bicubic, 3=Bilinear, 4=Nearest Neighbor (default=1Treeview) |
-a, --absolute-threshold=<absolute> | use the specified value for contrast thresholding in the heatmap (default=10) |
-p, --percentile-threshold=<percentile> | use the specified percentile value for contrast thresholding in the heatmap (try .95 if unsure) |
Color Options
| Option | Description |
|---|---|
--black | Use the color black for generating the heatmap (default) |
--red | Use the color red for generating the heatmap |
--blue | Use the color blue for generating the heatmap |
-c, --color=<custom> | For custom color: type hexadecimal string to represent colors (e.g. "FF0000" is hexadecimal for red). See http://www.javascripter.net/faq/rgbtohex.htm for some color options with their corresponding hex strings. |
Default colors are set for these tools so that no color needs to be specified for the program to execute. The following is an example of heatmap's default execution (uses black).
java -jar ScriptManager.jar figure-generation heatmap nucleosomes.cdt
There are also preset color flags are available for the user to choose from (blue).
java -jar ScriptManager.jar figure-generation heatmap nucleosomes.cdt --blue
However if you want to use a color outside the preset values, you can indicate RGB colors using hexstrings. You can read more about color customizations here.
java -jar ScriptManager.jar figure-generation heatmap nucleosomes.cdt -c 9400D3
Note user should not use the pound symbol (#) in front of the hexidecimal because it renders the token invisible to bash and thus, invisible to ScriptManager