Label Heatmap
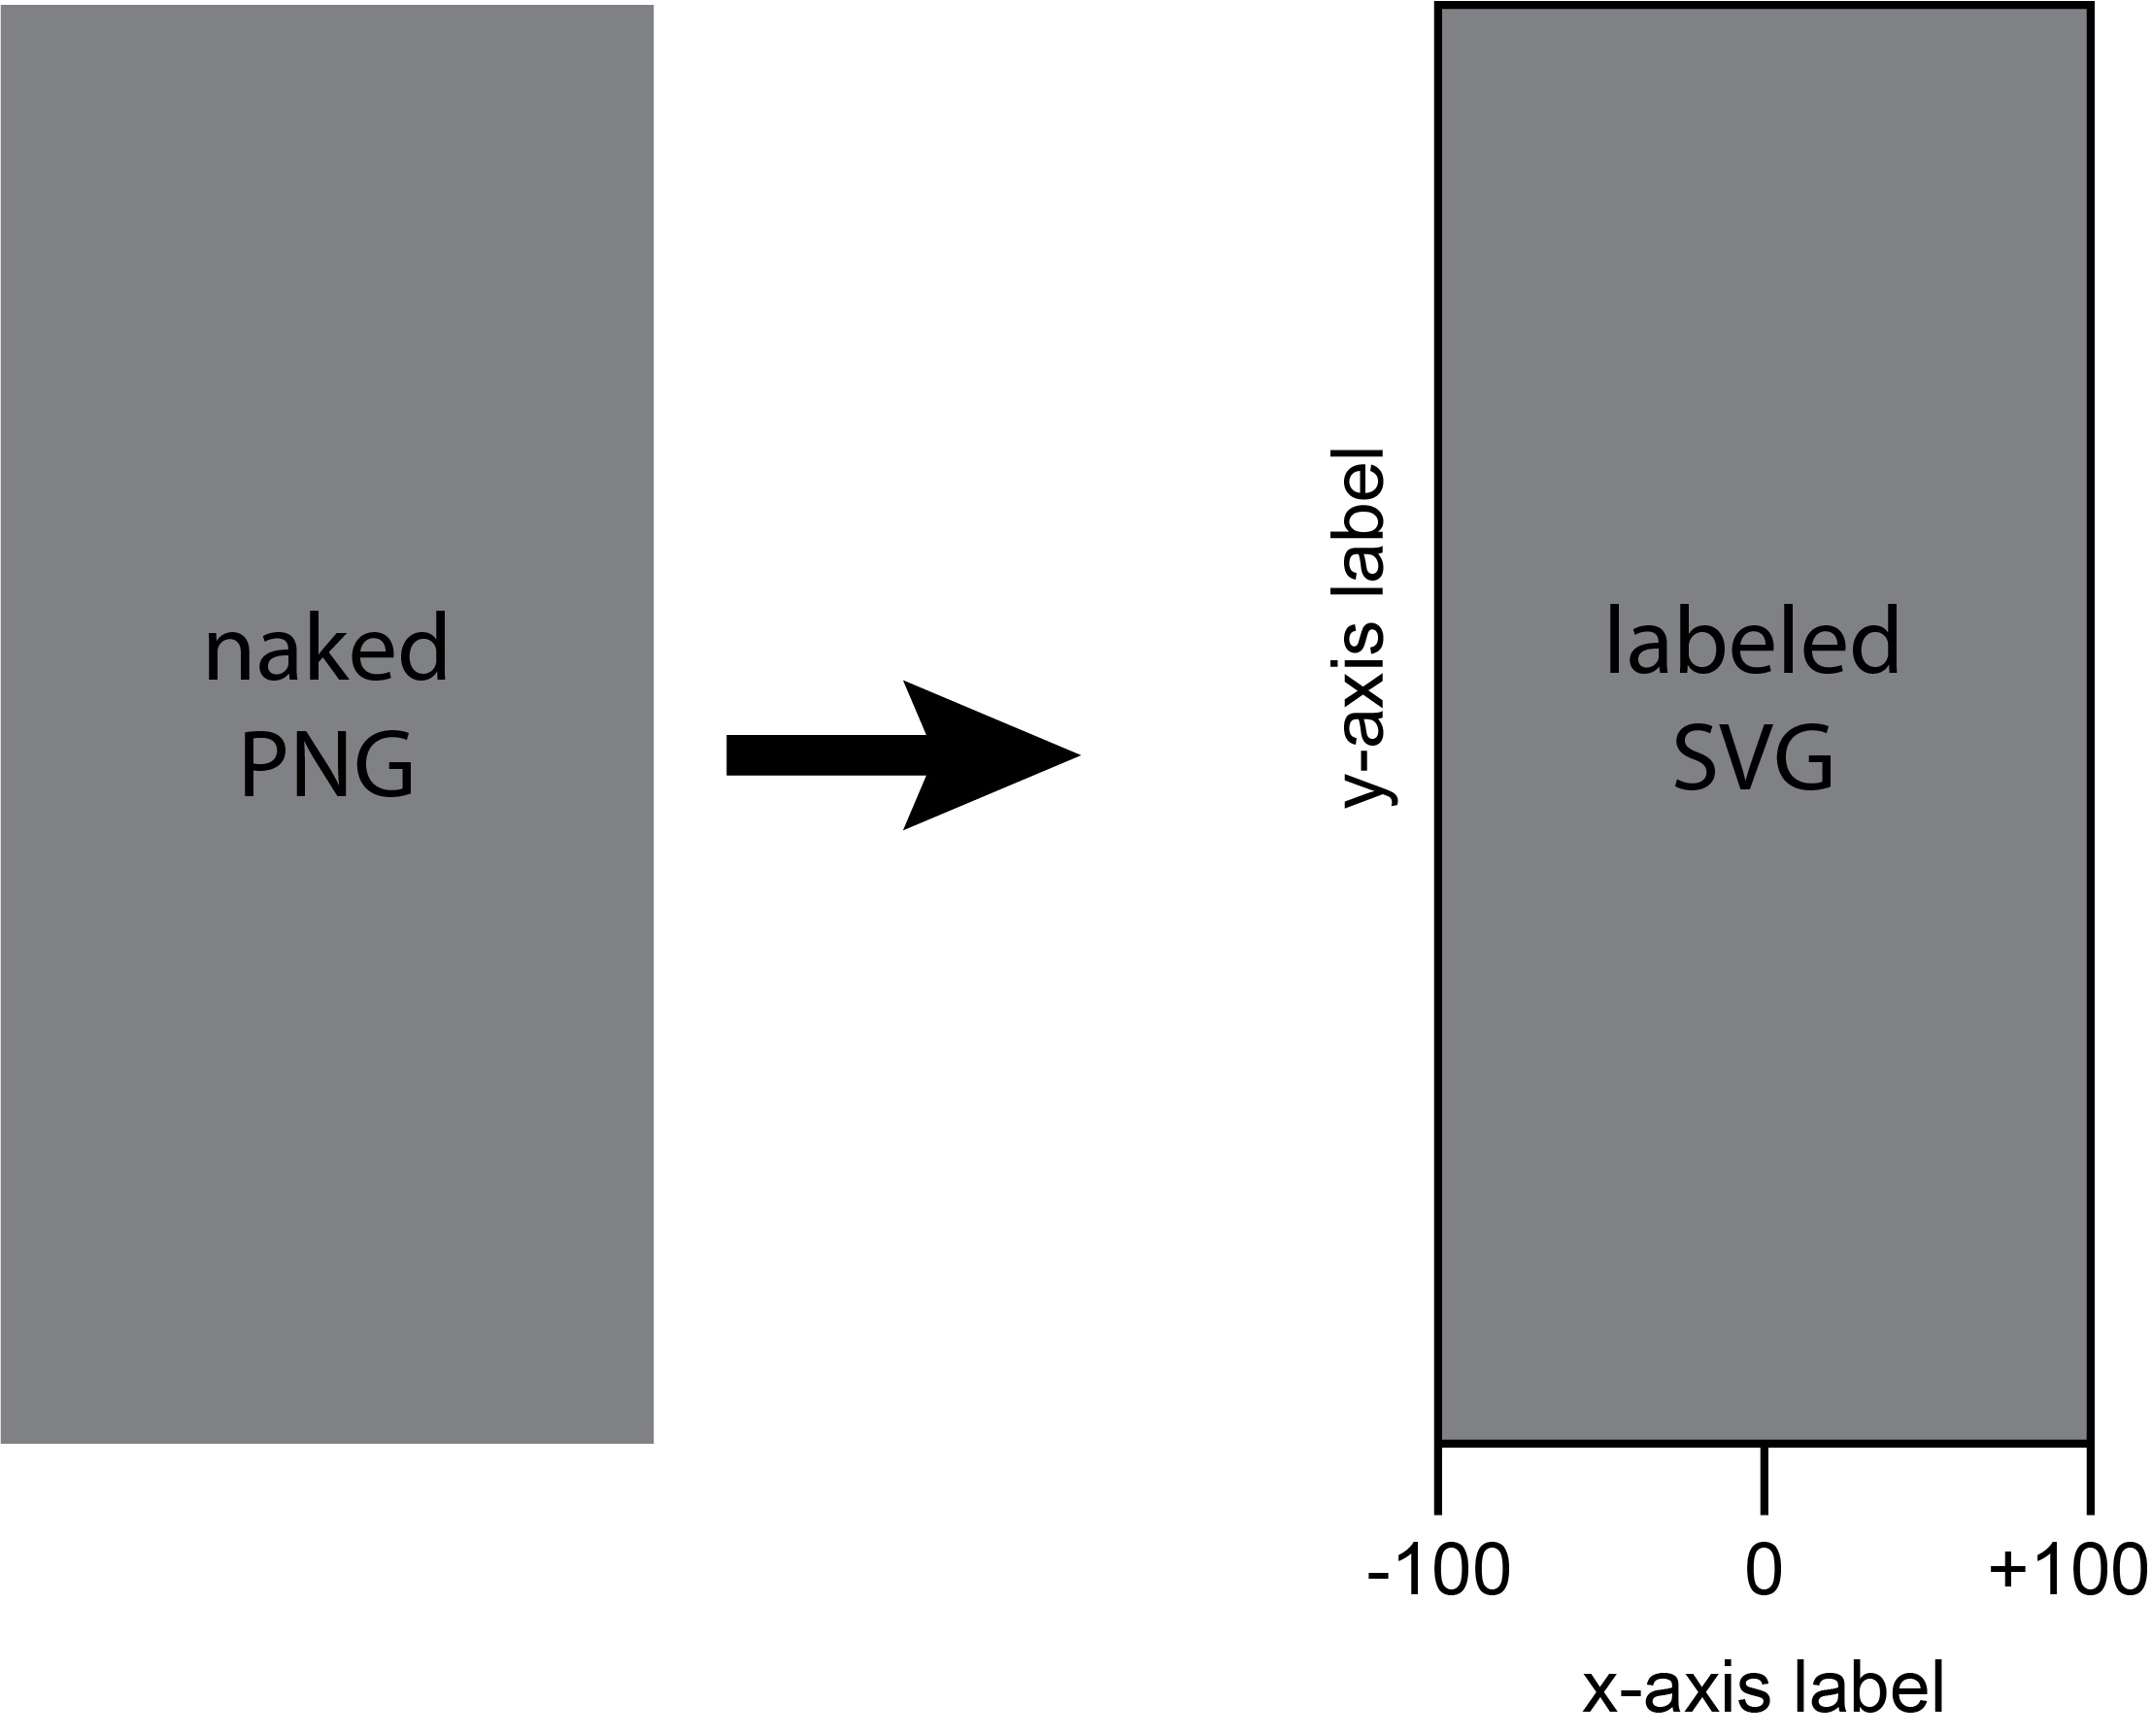
This tool will embed a .png file into an output .svg with a title and axes and tickmark labels.

Typically this tool is used to label merged ChIP-exo heatmap or other sequencing assay pileup heatmaps of tag counts but there is no reason it cannot be used for any input .png.

Any file with a .png extension may be loaded into the Label Heatmap tool. When a batch of files have been loaded, the user can type out axes labels, font size, specify border widths, colors, and tick height.
Clicking "Generate" will execute the script to write .svg files, each with one of the .png files embedded and annotated by the user-specifications. The output files will be named like the input files with the _label.svg suffix replacing the .png extension.
Input files (PNG)
This tool will embed a PNG file into an output .svg with a title, axes, and tickmark labels.
Axis Line formating
- Border width refers to the pixel width of all lines used from the border thickness around the PNG to the tick mark line widths.
- X-tick height refers to the pixel height/length of the lines along the bottom of the PNG that mark the left, right, and midpoint values.
- Color refers to the color value for all the lines making up the border and tick marks as well as the text color.
Label Formatting
These parameters refer to the formatting of the font in the SVG.
- Font Size will change the font size of all labels (both x-tick mark labels and axis labels)
- Left label refers the the minimum/leftmost x-axis tick mark label.
- Mid label refers the the midpoint x-axis tick mark label (typically 0 if plot derived from a reference set expanded from the center of a reference point).
- Right label refers the the maximum/rightmost x-axis tick mark label.
- X-axis Label refers the text used for describing the x-axis, typically describing a reference point.
- Y-axis Label refers the text used for describing the y-axis, typically describing the set of features that the heatmap/sequence plot is visualizing.
Command Line Interface
Usage:
java -jar ScriptManager.jar figure-generation label-heatmap [-hV] [-c=<color>]
       [-f=<FONTSIZE>] [-l=<xLeftLabel>] [-m=<xMidLabel>] [-o=<OUTPUT>]
       [-r=<xRightLabel>] [-t=<xTickHeight>] [-w=<borderWidth>] [-x=<xLabel>]
       [-y=<yLabel>] <PNG>
Description:
Create an SVG label for heatmap inputs.
Output Options
| Option | Description |
|---|---|
-o, --output=<OUTPUT> | specify output filename, please use SVG extension (default="OutputHeatmap.svg") |
Plot Design Options
| Option | Description |
|---|---|
-c, --color=<color> | indicate a color value; must be in Hex format (default=black) |
-w, --width=<borderWidth> | indicate the border width; must be an integer (default = 2) |
-t, --tick-height=<xTickHeight> | indicate the X-tickmark height (default=10) |
-f, --font-size=<FONTSIZE> | indicate the font size (default=18) |
-l, --left-label=<xLeftLabel> | indicate the left X-tick label (default=nolabel) |
-m, --mid-label=<xMidLabel> | indicate the mid X-tick label (default=nolabel) |
-r, --right-label=<xRightLabel> | indicate the right X-tick label (default=nolabel) |
-x, --x-label=<xLabel> | indicate the X-axis label (default=nolabel) |
-y, --y-label=<yLabel> | indicate the Y-axis label (default=nolabel) |