

ScriptManager
Toolbox for analyzing your genomic datasets

Figure Gallery
- ChIP-exo
- Genomic Features
- ATAC-seq
- Genome Tracks

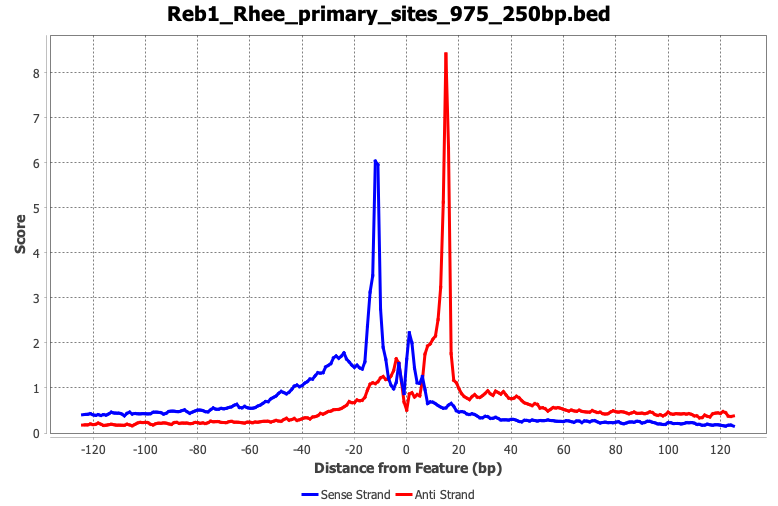
ScriptManager supports strand-specific base-pair resolution analysis of base-pair resolution assays like ChIP-exo. Shown here are examples of the two-color merged heatmap (left) and composite plot (right) analyses of real ChIP-exo data.
View tutorial

Visualize genomic patterns such as a figure called a "Four Color Sequence Plot" which shows nucleotide enrichment across a set of protein-bound sites .
View tutorial
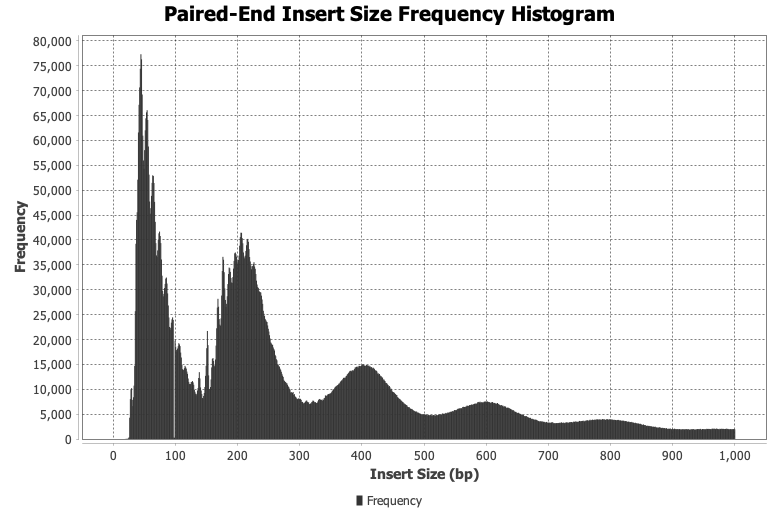
Perform quality checks of genomics data like calculating fragment insert size histograms for ATACseq data.
View tutorial

Build strand-specific base-pair resolution genome tracks from BAM files. Shown here is the strand-separated 5' Read 1 tag pileup from real ChIP-exo data.
View tutorial